It's one thing to buy an advanced CRM like HubSpot but another to use that CRM to its full potential. When you do that, you eliminate disjointed processes to take your B2B technology company’s sales and marketing to the next level.
With HubSpot Marketing Analytics Dashboards, you have real-time, actionable sales and marketing performance at your fingertips. Use it to make more data-driven decisions now. Unlock growth, generate the experience your customers want, and streamline the sales funnel to get predictable results.
The Pre-Work
Define a Primary Goal for Your B2B Technology Company
Before you lay a hand on CRM software, it's time to reevaluate your goals. What do you expect HubSpot technology to help you do better? What makes it worth the investment of your time and money?
Chances are your goals look like this:
- Direct traffic to the website
- Increase engagement with content
- Increase your conversion rate
- Generate sales-qualified leads
- Increase revenue
Now, looking at these goals as a progression toward the ultimate goal (higher revenues), consider which of these milestones you really need to beef up to start meeting the goals after it. Make that your primary goal. It's not to say you stop tracking other things, but this is where you really want to see some movement. Add a second or third complementary goal around it.
Decide What to Measure
Which metrics represent the meeting of this goal? It should always be relevant and fit into the bigger picture. For example, increasing website traffic by 50% is only relevant if a significant portion of that increase is your target customer. How will you measure the quality of traffic? You need a set of metrics together to understand that.
Determine How this Dashboard Will Be Used
Who needs access? Will they be checking it daily, weekly, monthly, or as needed? What information do these individuals need to see? You can customize dashboards for different job roles to ensure everyone has access to the data they need to perform.
Getting Started
Create Your HubSpot Dashboard
- From the Dashboards Page in your HubSpot Account, choose “Create Dashboard.”
- On the left, select a type of template.
- Choose a template for your B2B technology company
- Browse through the report options to narrow it down to reports that represent what you chose to measure in steps 1 & 2.
- Uncheck boxes, remembering less is more. Focus on what's most important. That's what we want this dashboard to represent.
You can also choose to start with a blank dashboard and build it by adding instead of subtracting.
Set Up Privileges
Determine who on your team needs access to this dashboard.
Bonus tip: don't be stingy with data. As a general rule, the more access you give front-line employees to performance data, the better they perform. For a front-line employee, data "gamifies" performance because it can provide instant feedback. The human brain thrives on problem-solving and instant feedback, which is what games give us. Help marketing professionals tap into their full potential through gamification.
You'll also have the option to set it to view only or edit to prevent unauthorized editing. If you have the Enterprise version, you can set this up at a team level rather than by individual.
Start Monitoring Your Performance
Now, it's time to put your marketing analytics to work for you. Get the most out of the HubSpot Analytics Dashboard by:
- Note how your campaigns are performing across channels.
- Identify your highest performing channels overall through HubSpot's marketing attribution features.
- Uncover untapped potential in channels you're underutilizing.
- Reallocate resources to increase marketing ROI.
- Enhance how sales and marketing work together by better understanding what a sales-qualified lead looks like in the early through later stages of the buyer's journey.
Fine-Tuning Your Dashboard
Compare Segments
We often look at revenue as a whole and begin to believe that the current customer acquisition costs are the best they can be. But often, reality is more like the 80/20 rule. This rule suggests that 20% of your efforts are likely delivering 80% of your results. As the story goes, when you can tap into that 20% and expand it, you increase marketing ROI.
Comparing segments of customers helps you understand who the "real" ideal and most qualified customer is for your B2B technology company.
Additionally, comparing segments in your dashboard reveals how well you're nurturing the various segments. Maybe segment A is outperforming B because you're putting more resources toward A when B could have potential.
A/B Test Your Emails
For most industries, email has the highest potential marketing ROI (between 38:1 and 44:1). But to achieve that, you must build an engaged, permission-based subscriber list and regularly deliver relevant content.
In addition to testing segments, test content in A/B fashion and track it in your marketing analytics dashboard. You can A/B test elements like:
- Open rate
- Click-through rate
- Conversion rate on your landing pages (Just direct A or B to a different page)
When creating an email in HubSpot,
- Select Run a Test in the top left.
- Give B variation a name.
- Run A for a period, sending to a subsection (or cross-section) of your subscriber list.
- Collect & Analyze data in the dashboard.
- Run B, and repeat. If it gives you a statistically relevant improvement, make it your new A.
- Continue testing B's against your A’s to maximize marketing ROI.
This kind of rapid experimentation is key to continual growth. HubSpot Analytics Dashboard supports your efforts to cut costs through more data-driven marketing decisions.
Increase Marketing ROI for Your B2B Technology Company
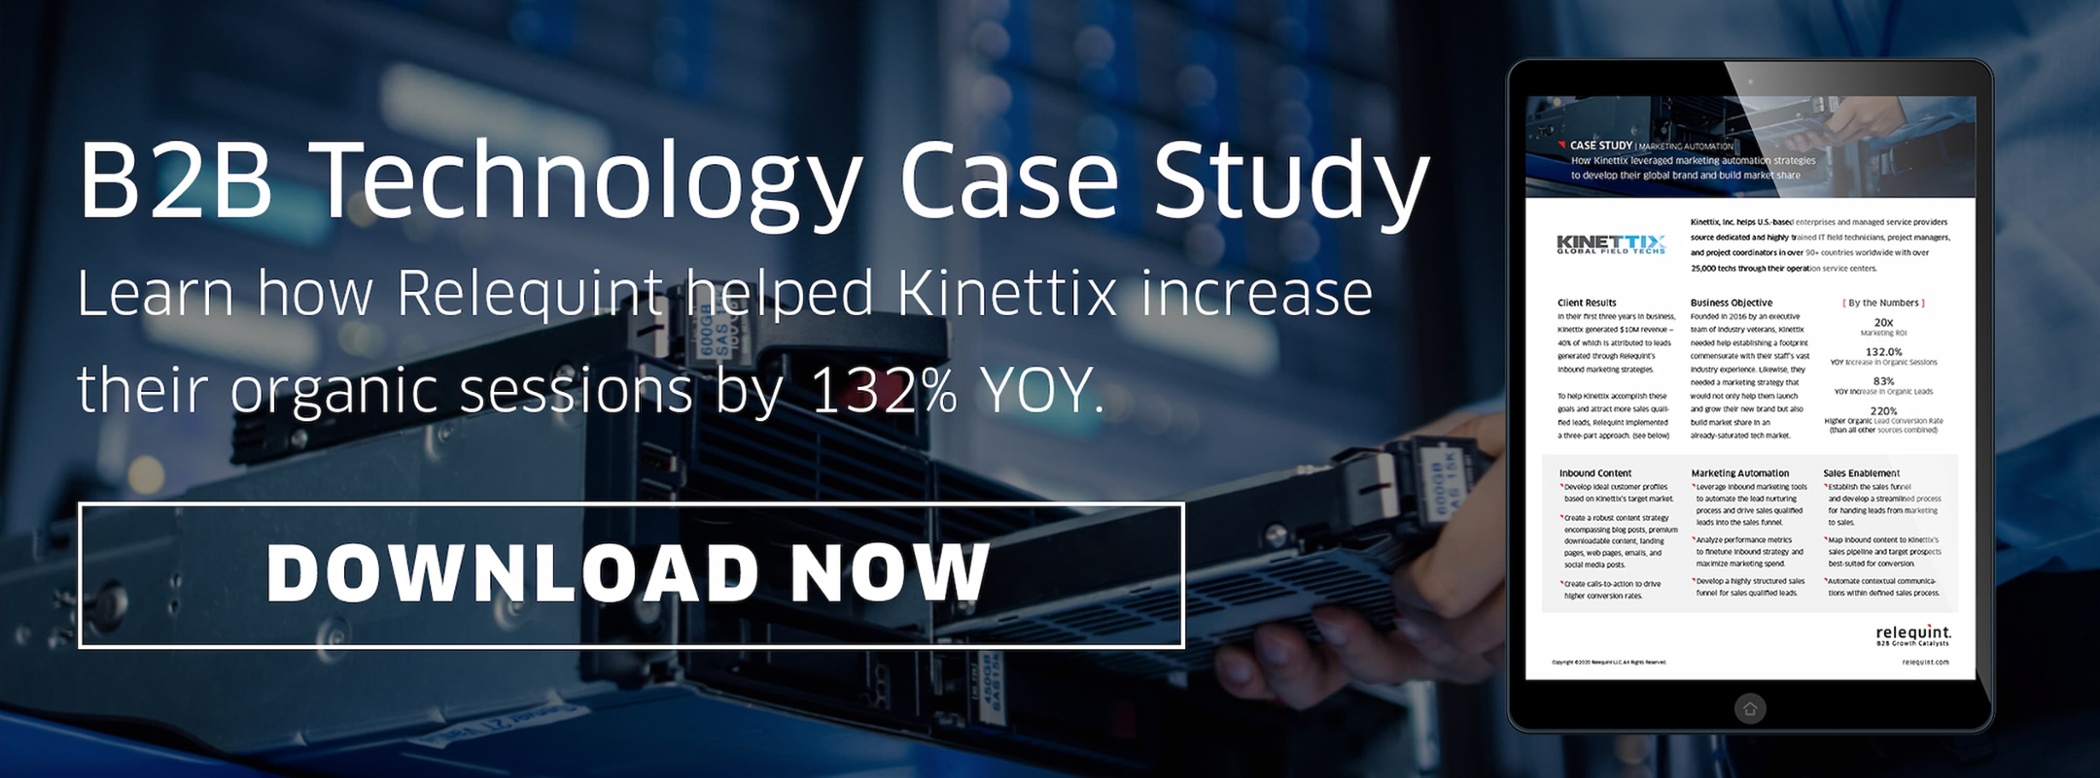
Do you want to see these principles in action? Download this case study to see how one B2B technology company leveraged its own marketing analytics dashboard and marketing automation to increase leads by 83% and conversion rate by 220%.![]()


 By
By 
